


🔬 Research Summary by Seyed A. Esmaeili, who received his PhD in Computer Science from the University of Maryland, College Park. He will join the Simons Laufer Mathematical Sciences Institute at Berkeley and the Data Science Institute at the University of Chicago as a Postdoc.
[Original paper by Seyed A. Esmaeili, Darshan Chakrabarti, Hayley Grape, and Brian Brubach]
Overview: In recent years, computational and sampling methods have had a significant impact on redistricting and gerrymandering. In this paper, we introduce a distance measure over redistricting maps and study its implications. First, we identify a central map that mirrors the Kemeny ranking in a scenario where a committee is voting over a collection of redistricting maps to be drawn. Second, we also show how our distance measure can be used to possibly detect gerrymandered maps. Specifically, some redistricting instances known to be gerrymandered are found to be outliers, being in the 99th percentile in terms of their distance from our central maps.
Introduction
Redistricting is the process of partitioning a state into a collection of districts that satisfy a set of constraints. These constraints, however, are not stringent and allow for an enormous number of valid redistricting maps, hence the possibility of gerrymandering. Despite the fact that gerrymandering dates back at least two centuries, it is only in the last decade that mathematical and computational methods have had a significant impact. In a nutshell, the works of Chikina et al., DeFord et al., and Herschlag et al. introduced sampling methods that have been and continue to be used to detect possible gerrymandering. Specifically, these sampling methods produce a large ensemble of valid redistricting maps, which can then be used to estimate various informative statistics, such as the election histogram. Therefore, one can, for example, use the election histogram and argue that a given map is gerrymandered because of the rarity of its election outcome.
This paper introduces a distance measure to analyze an ensemble of redistricting maps. We focus on two major implications of this distance. First, we define a central map that may be considered “most typical” and give a rigorous justification for it by showing that it mirrors the Kemeny ranking in a scenario where a committee is voting over a collection of redistricting maps to be drawn. Second, we show that a by-product of our framework is the ability to detect some gerrymandered instances since they can have very large distances from our central maps compared to the entire ensemble.
Key Insights
Distance over Redistricting Maps
Since there is a large ensemble of valid redistricting maps, introducing a distance measure over these maps seems like a reasonable idea that can help tame the difficulty in analyzing them. Interestingly, two immediate implications of having a distance over a collection of objects are the existence of a central object which lies at a minimum distance from the collection and an outlier object that lies further away from the collection. But before delving into these implications, we describe our distance measure over redistricting maps.
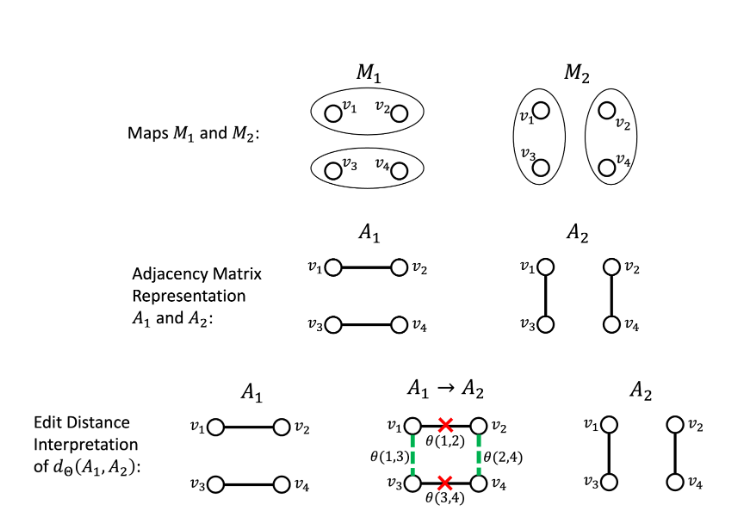
Given two maps, M1 and M2, we create an adjacency matrix for each by connecting voting blocks (vertices) in the same district by an edge. Each edge has a non-negative weight associated with it that we can choose. The distance is simply the minimum total weight of edges that must be deleted and added to obtain one of the maps starting from the other, as shown in the figure.
The Medoid Map and its Justification
As we noted earlier, now that we have defined a distance measure, a ”central” redistricting map must exist that minimizes the distance from the ensemble, which we call the medoid map. Although, at an intuitive level, it seems interesting to compute, it is worthwhile to wonder if the medoid map has deeper utility and a rigorous justification. We find that it actually mirrors the Kemeny ranking.
More specifically, suppose that we have a committee voting over a collection of maps to select one to be drawn. If we were to weigh the distance from each map by the total number of votes it receives, the medoid map would be the map that minimizes the sum of weighted distances. This definition of the medoid redistricting map is essentially the mirror of the Kemeny ranking if the committee voted on rankings instead. We actually show that, in general, it is computationally hard to obtain the medoid map, but we introduce a heuristic method for finding it.
Outlier and Gerrymandered Maps
As we noted earlier, the sampling methods of Chikina et al., DeFord et al., and Herschlag et al. have had a major impact by showing that certain maps are gerrymandered since their election outcomes are rare.
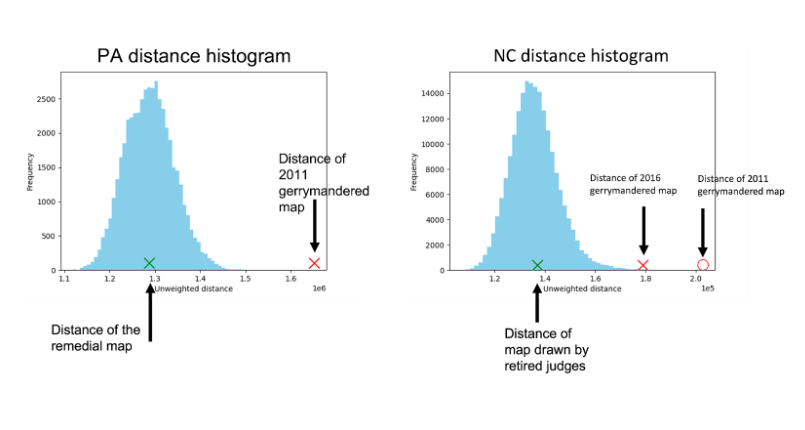
Now that we have a distance measure, we can also detect maps that are outliers in terms of their distance from the ensemble or a central map. The idea of flagging a map as an outlier because of an abnormal measure (abnormal distance) connects to anomaly detection in machine learning. Further, it would be interesting to see if gerrymandered maps are also outliers regarding their distance. We arrive at a very interesting result. Specifically, as the figure below shows, for both Pennsylvania and North Carolina, maps that are considered to be gerrymandered are found to be outliers in terms of distance, whereas remedial maps are much better behaved. At a more precise level, we find these gerrymandered maps to have distances in the 99th percentile across repeated experiments consistently. Although this distance-based method is not likely to be able to detect all instances of gerrymandering, we believe it represents significant progress since it does not rely on election results at all.
Between the lines
The distance measure we introduced is both tractable and has an intuitive edit distance interpretation. However, it is worthwhile to wonder if this distance measure or another possible distance over redistricting maps can be justified in a rigorous manner based on an axiomatic approach.
We believe that a major contribution of our work is that it has demonstrated that outlier behavior can be detected in some gerrymandered instances without using election results in a rigorous manner by giving the distance percentile of the map. Arguing that a gerrymandered map is an outlier without using election results has a clear advantage. It would be interesting to see if other methods that do not use election results can also be used to detect gerrymandering.
References
Chikina, M., Frieze, A., and Pegden, W. (2017). Assessing significance in a markov chain without mixing. Proceedings of the National Academy of Sciences, 114(11):2860–2864.
DeFord, D., Duchin, M., and Solomon, J. (2019). Recombination: A family of markov chains for redistricting. arXiv preprint arXiv:1911.05725.
Herschlag, G., Kang, H. S., Luo, J., Graves, C. V., Bangia, S., Ravier, R., and Mattingly, J. C. (2020). Quantifying gerrymandering in north carolina. Statistics and Public Policy, 7(1):30–38