
🔬 Research Summary by Shuli Jones, a recent MIT MEng in Computer Science and current software engineer at Google.
[Original paper by Shuli Jones, Isabella Pedraza Pineros, Daniel Hajas, Jonathan Zong, and Arvind Satyanarayan]
Overview: Blind and low-vision people who use screen readers rely on textual descriptions to access data visualizations. While a visualization affords various data analysis tasks for sighted readers, a textual description presents a fixed set of affordances due to limited space and a linear reading order. To address this, we identified four key characteristics of customizable descriptions. We implemented them in a prototype to help screen reader users reconfigure text to suit their varied interests and needs.
Introduction
Blind and low-vision (BLV) users access data visualizations using screen reader assistive software that reads textual descriptions aloud as text-to-speech. Like sighted users, screen reader users have a variety of tasks they want to accomplish when interacting with data visualizations — for example, focusing on the overall trend or examining individual data points of particular interest. Sighted readers flexibly switch between these tasks by attending to different parts of a visualization. In contrast, screen reader users must make do with a fixed set of information presented in a linear reading order.
Our research explores how customizable descriptions can allow screen reader users to more easily access the information they need at the moment. We identified four key customization characteristics for textual descriptions based on the unique needs of screen reader users. We implemented these as an extension to Olli, an open-source tool for converting visualizations into accessible text structures. We tested the system with screen reader users. We found that our characteristics are helpful for effective customization but also that user preferences about when and how much to customize vary widely, making it important to design flexible customization with various users in mind.
Key Insights
Customization is Key
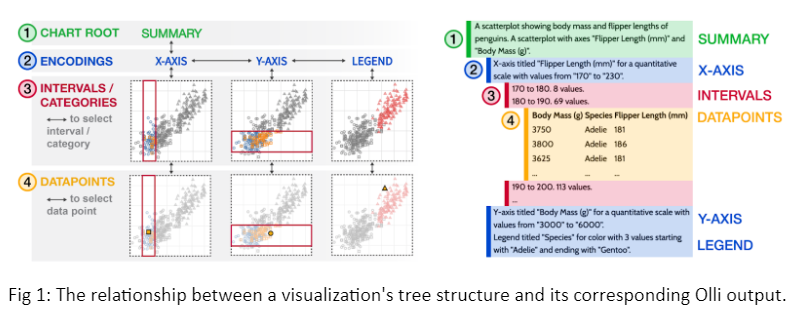
Recent research in accessible data representations has suggested that hierarchical structures of textual descriptions effectively enable screen reader users to conduct self-guided data exploration at varying levels of detail. This approach is exemplified by Olli, an open-source tool maintained by the MIT Visualization Group. Olli converts visualizations into keyboard-navigable tree structures. Higher levels of the tree provide a broad overview of the data, whereas lower levels focus on subsets of data and provide more granular details. Users can start with an overview of the data and then choose for themselves where and how deeply they want to focus.

Because screen reader users listen to descriptions one at a time, and because there is a fixed linear reading order, it can be frustrating and inefficient if the most relevant information is at the end of a description. It can also be frustrating if too much or insufficient information is included. In the initial versions of Olli, users had no control over these aspects of the description. Because different kinds of information are more useful depending on the task the user is trying to accomplish, no single fixed description provides the best configuration in all situations. To address this, we aimed to add customization options so users could reconfigure descriptions to include the information and phrasing that meets their changing needs.
Four Characteristics of Customizable Descriptions
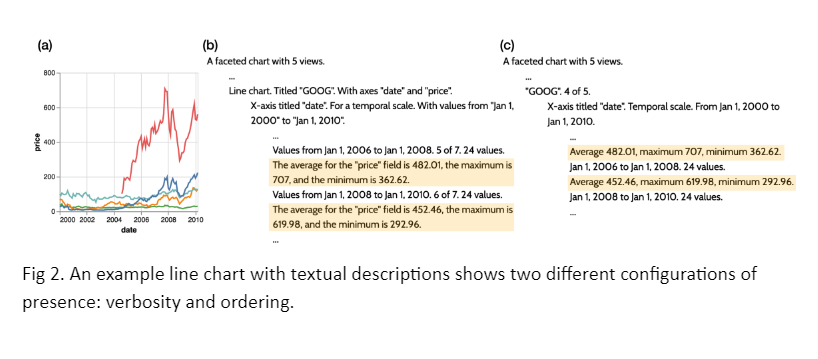
To think systematically about how different parts of textual descriptions afford different tasks, we created a framework for customization that represents a description as an ordered list of discrete string tokens. We extended Olli with a system for allowing the user to reconfigure the tokens according to four characteristics of our framework: presence, or which tokens are present in the description; verbosity, or the length and conciseness of the information in each token; ordering, or how the tokens are sequenced; and duration, or for how long a customization is in effect. We developed these characteristics and their implementation in Olli through an iterative co-design process with Daniel Hajas, our blind co-author.
Our four characteristics help reduce cognitive load by allowing users only to include the needed information (presence), adjust how much detail that information is presented with (verbosity), and prioritize which information to hear first (ordering). The fourth characteristic, duration, allows users to set ephemeral customizations for ad-hoc tasks and persistent ones that they want to be always active.

These characteristics are based directly on the affordances that screen readers provide. Because of screen readers’ fixed linear order, users cannot skip back and forth or skim but must wait to hear the information they need. This makes interacting with data take longer, and it also increases the cognitive load of doing so: users have to pay close attention to hear when the information they need is being read out and must then commit it to working memory since they are not able to have only that information read back on demand. The characteristics reflect different ways screen reader users might seek information.
Testing with Users in Olli
We added customization options in Olli to allow users to adjust presence by toggling types of tokens on and off, adjust verbosity between three levels, and adjust ordering by changing the tokens’ position in a list. To control duration, users can specify persistent customizations through a settings menu or ephemeral customizations in a command box. Persistent customizations’ effects last until they are changed by the user, while ephemeral customizations may revert on their own or last for a single action.
We conducted a study with 13 BLV screen reader users, asking them to perform tasks on two datasets and interviewing them about their experiences with accessing data visualizations and with customization. Most participants were very excited to have the chance to customize the text they hear – something they felt was frequently neglected by interface designers – and expressed that our four characteristics were very helpful for accessing information efficiently. However, participants noted that customization requires an upfront cost to learn and use effectively. This meant that our choice of defaults was more influential on their overall experience.
Between the lines
Designing better accessible data representations can contribute to information equity by making data analysis not merely accessible but also usable and enjoyable. Our research supports the idea that there is no such thing as one-size-fits-all accessibility. Instead, designers should aspire to create flexible software interfaces that prioritize user agency. Many participants discussed how frustrating it can be when software makes incorrect assumptions about their goals and needs. We also saw that participants who were less experienced with technology struggled with features that were missing explanations or had poor discoverability. To meet a wide range of needs, it’s important to have sensible defaults, learnable features, and in-depth customization options.
Now that we’ve developed a framework for thinking about types of description tokens and their affordances, our upcoming work will explore the use of LLMs in generating the content of tokens. Many users are excited about LLMs for their ability to help understand data by incorporating contextual information into explanations. However, plausible-sounding but inaccurate descriptions can lead to users making ill-informed decisions in high-risk situations. Future work in accessible textual description must consider the presentation and verification of AI-generated content.
